
Your Profit and Loss,
your way
One Excel worksheet controls the order, hierarchies, headings, subtotals and formatting while Power BI does the rest.
Download nowUpdate the UDM to drive the Profit and Loss formatting.

What is included
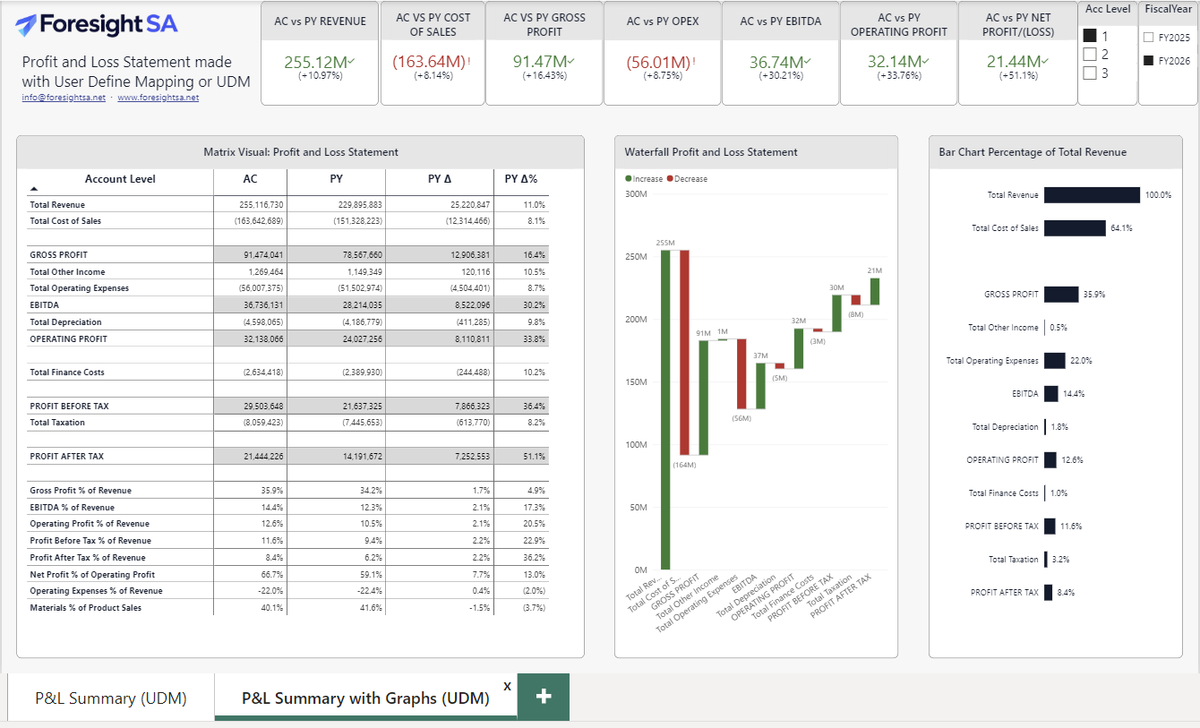
Microsoft Power BI PBIX file
Profit and Loss dashboard driven by the UDM, using our demo data.
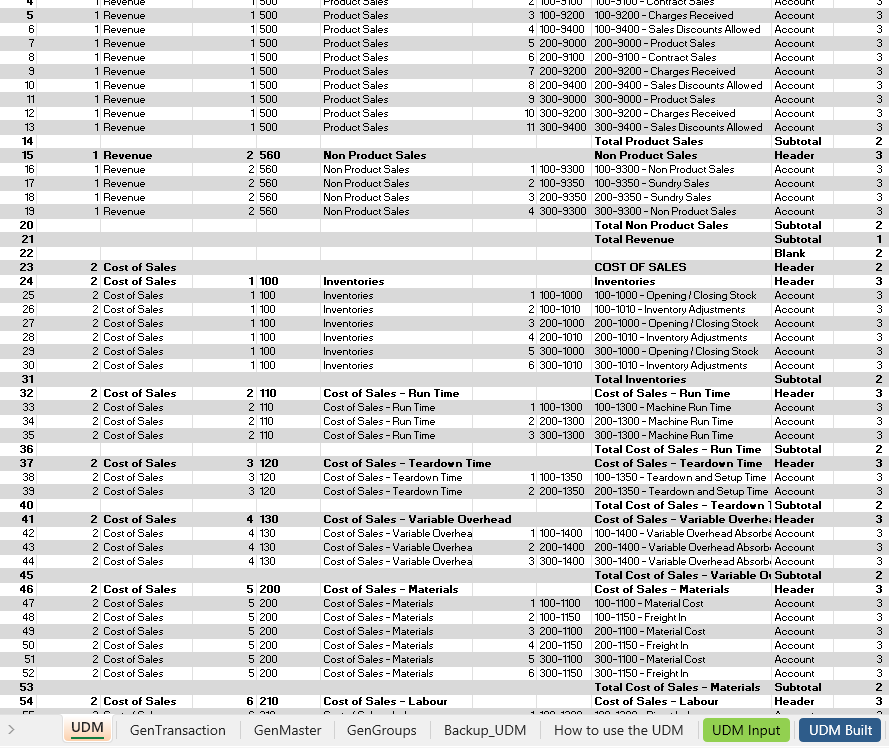
UDM Microsoft Excel file
Containing the User Defined Mapping (UDM), demo data and instructions.
Watch it being built
Want to see what is possible with a UDM?
Find our Profit and Loss Analysis App on Microsoft AppSource. FREE download with demo data.
Try it for FREE on Microsoft AppSourceMore about custom Profit and Loss layouts in Microsoft Power BI
Build a Custom Profit and Loss Layout in Microsoft Power BI
ERP systems can produce Profit and Loss statements or reports but cannot give users control over the layout for the sort order, hierarchies, formatting, custom wording of headings and totals, include and exclude lines or any of the above. Accountants and finance professionals demand flexibility. Using a User Defined Mapping table or UDM provides developers and report designers a platform to build the Profit and Loss statements, reports and financial KPIs specified and demanded by management.
Each row in the UDM is one line in the Power BI Profit and Loss matrix. Row position determines display order, while remaining columns control:
- Section headings and GL group hierarchy
- Blank spacer lines
- Group totals and section totals
- Subtotals such as Gross Profit, EBITDA and Profit After Tax
- Ratio and percentage lines
- Display signs and row colours
- Three levels of detail, from section totals down to individual GL accounts
Free download includes a Microsoft Power BI file with two report pages, a Profit and Loss dashboard and a Profit and Loss alongside waterfall and percentage charts, plus a Microsoft Excel workbook containing the UDM, UDM Builder, demo data and setup notes.
Designed for SYSPRO but can be adapted to Sage, SAP or any similar ERP system. Replace the three source tables, General Ledger transactions, chart of accounts and account groups, with equivalents from your own system, keep the same UDM columns, and the Profit and Loss is built the same way.